Student Dashboards
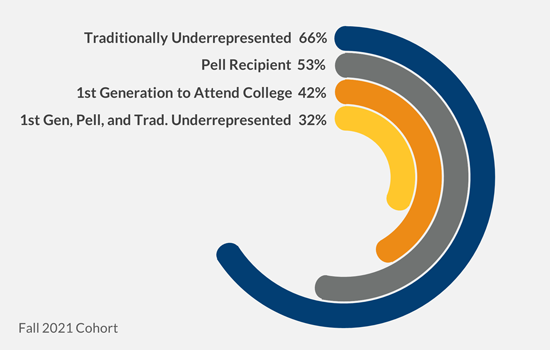
Student Dashboards represent a multi-year summary of current and trend data for the university, including the admissions, demographic and enrollment characteristics of the institution's student body, and various outcome measures. Student summary data is based on the CSUB census date.
Note: All dashboards allow filtering by year or term, as well as university, college, department, and in some cases program-level data are available. Hover your mouse over the graph in order to see more detailed information. Use the "download" button at the bottom-right corner of the screen to download the dashboard as a PDF, allowing you to print what you see. The "revert" button allows the user to clear all filters and view the original report.
For more information about how to use a Tableau dashboard, visit our Dashboard Tutorial page.
Enrollment Dashboards
Name of Report: Student Enrollment
Purpose of Report: The student enrollment dashboard includes student headcount, FTE (full-time equivalent), average unit load by college, age, race/ethnicity, SES, and more. The total headcount is based on unique count of students enrolled at Main and Antelope Valley campus and may not add up. Report Type “All” filter is based on unique count of students enrolled at State-Side and Self-Side and may not add up.
Population of Interest: All enrolled students at census date.
Publishing Date: 08/15/2023

Student Success Dashboards
Name of Report: Student Progression and Graduation (Undergraduates)
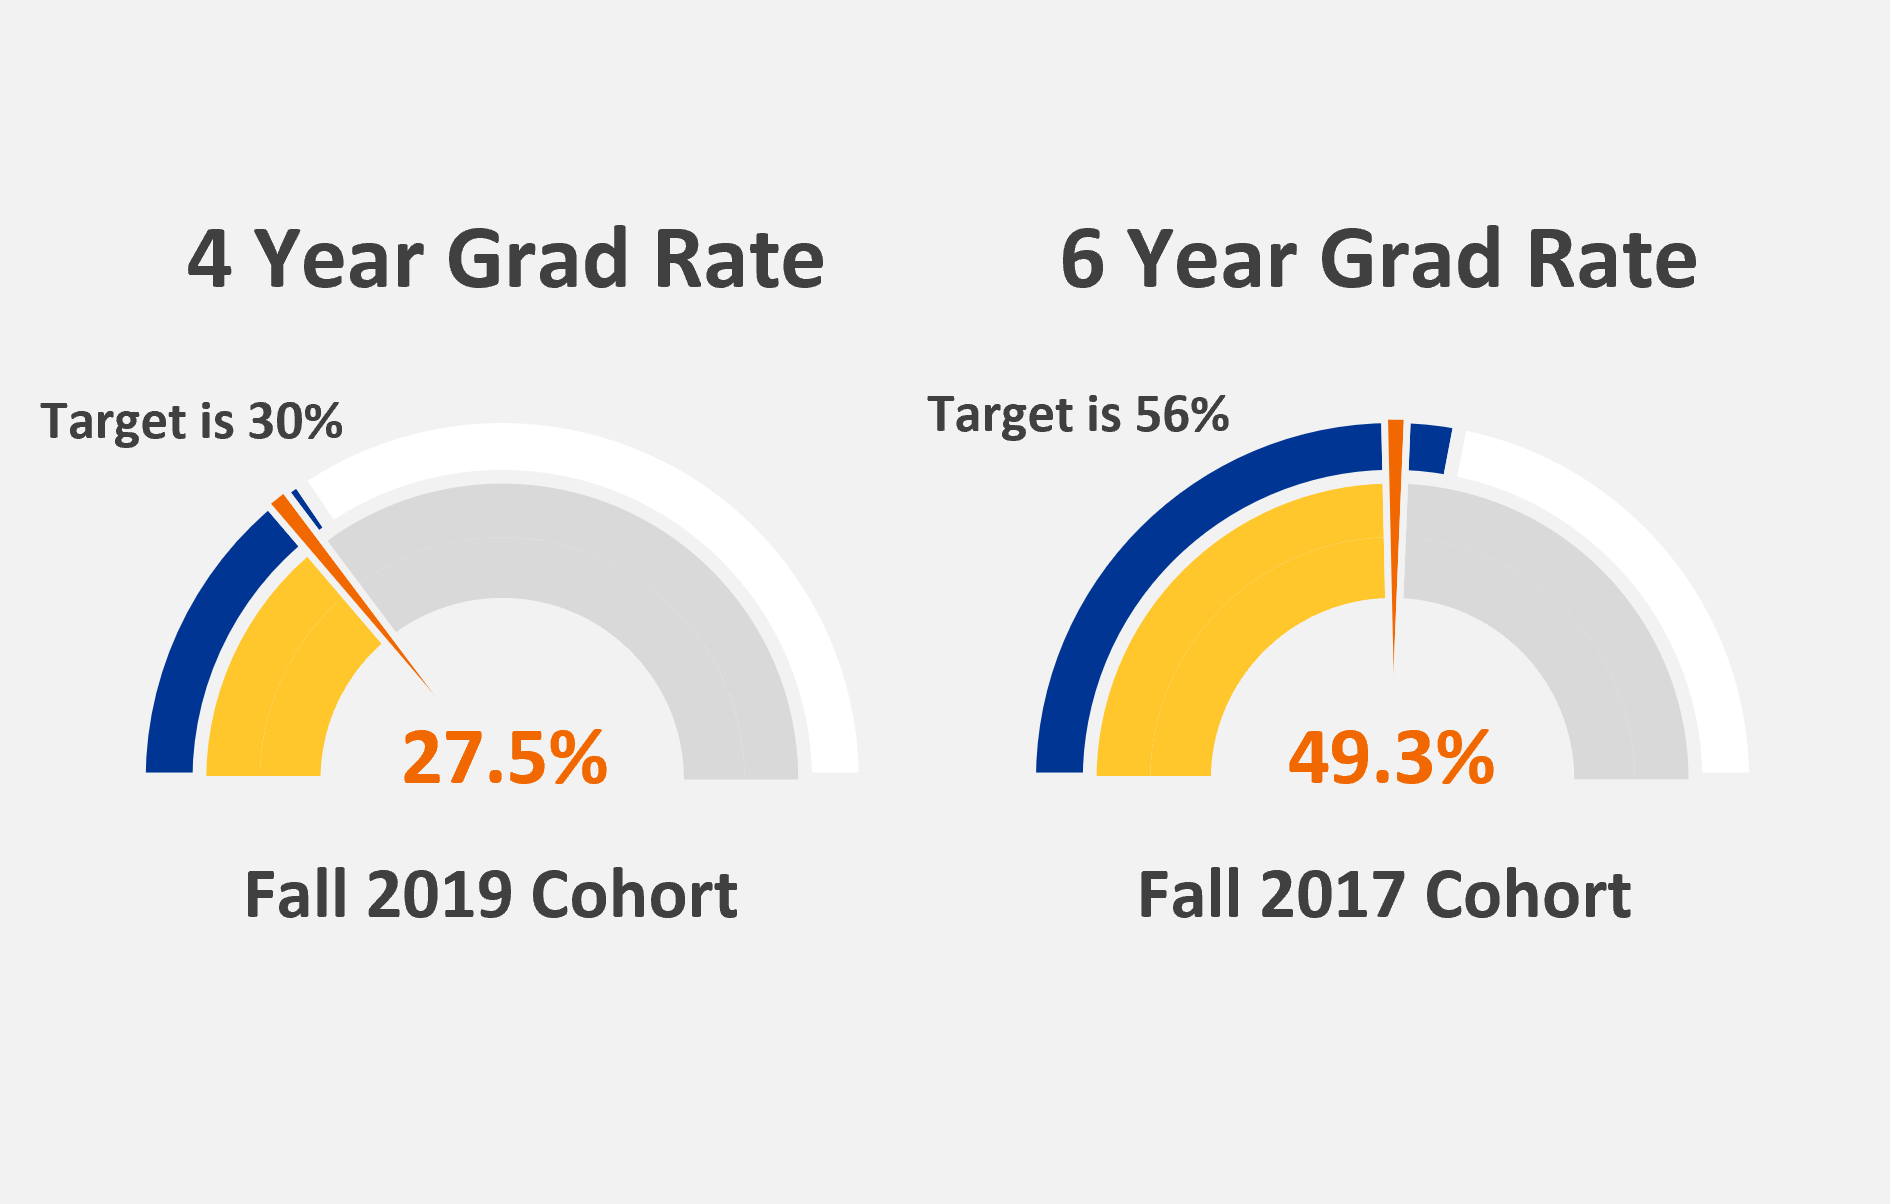
Purpose of Report: The dashboard includes information on UNDERGRADUATE retention, graduation, and persistence rates by institution, college, race/ethnicity, Pell received, and other characteristics. Additionally, transfer retention and graduation rates are also displayed.
Population of Interest: Students who entered the university as First-Time Full-Time Freshmen and New Community College Transfers in Fall.
Publishing Date: 08/15/2023
